Smallest LLMs improving faster than SOTA?
Every AI headline you've read this year reports the same number: who's in front. Claude Opus, 88.6. GPT-5.5, 88.7. It's the most-quoted statistic in the industry and the least useful one, because a lead is a fact about the past.
A more meaningful number nobody quotes is the rate of change (RoC): the slope.
In December 2024 the best open-weight coding model that fits on one consumer GPU scored 20.6% on SWE-bench Verified. It now scores 77.2%. It's still 18.3 points behind the closed frontier, and it's eating into that distance faster than anything else on the board: 2.73 points per month against the closed frontier's 1.83.
The lead belongs to closed AI. The RoC to models you can download and run on a gaming PC. Which of those two facts matters depends entirely on how much track is left.
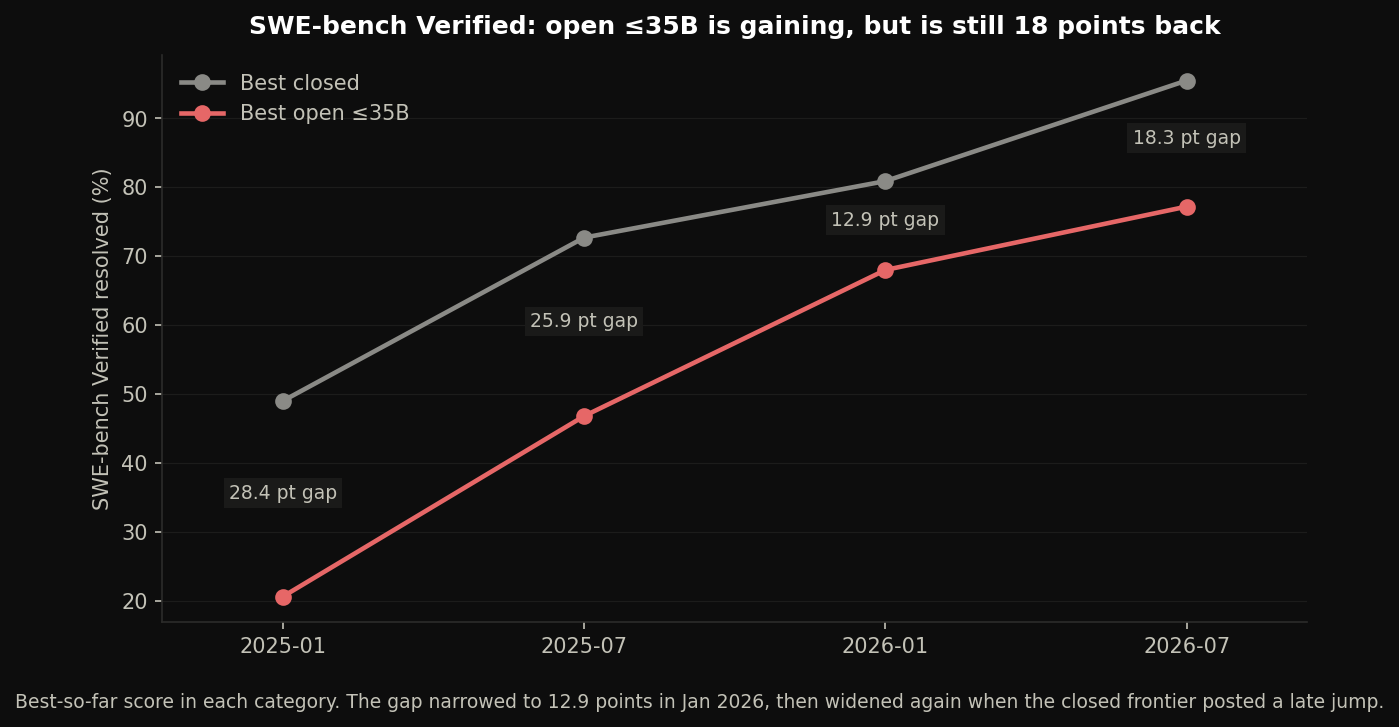
All data sourced from the live clankwright.com open-source LLM benchmark dashboard, which refreshes daily against benchlm.ai and SWE-rebench. Figures link to its live, interactive version, so you can hover the points and check individual models' data points yourself.
Trends
- The lead: the closed frontier is comfortably ahead. By 18.3 points on SWE-bench Verified and 20.5 on decontaminated SWE-rebench. It isn't close.
- The slope: open sub-35B is the fastest-improving category on coding benchmarks. On SWE-bench Verified it gains 2.73 points per month against the combined closed frontier's 1.83 (p = 0.008). Against larger open-weight models it is faster still (p = 0.007).
- Time will tell. At current rates the gap takes 1.7 years to close on SWE-bench Verified and 2.7 on SWE-rebench, with confidence intervals reaching past 2030. An advantage of 0.9 points a month doesn't erase an 18-point deficit in a hurry.
1. The current leaders
Best model in each camp. Subtract. Done.
| Benchmark | Best closed | Best open ≤35B | Gap |
|---|---|---|---|
| SWE-bench Verified | 95.5 | 77.2 | 18.3 |
| SWE-rebench (calibrated) | 62.7 | 42.2 | 20.5 |
Two decisive closed-lab wins, and the gap doesn't even shrink politely. On SWE-bench Verified it ran 28.4, then 25.9, then 12.9, then back up to 18.3 across the last four half-years, because the closed labs posted a late jump to 95.5.
Stop reading here and the story is "closed AI is winning." That's true. It also tells you nothing whatsoever about 2028.
2. The RoC slope
Fit a least-squares line through every release a category shipped, throw out only the extreme outliers, and read the slope. Every model counts, the duds as well as the flagships, so the number describes a category rather than its best day.
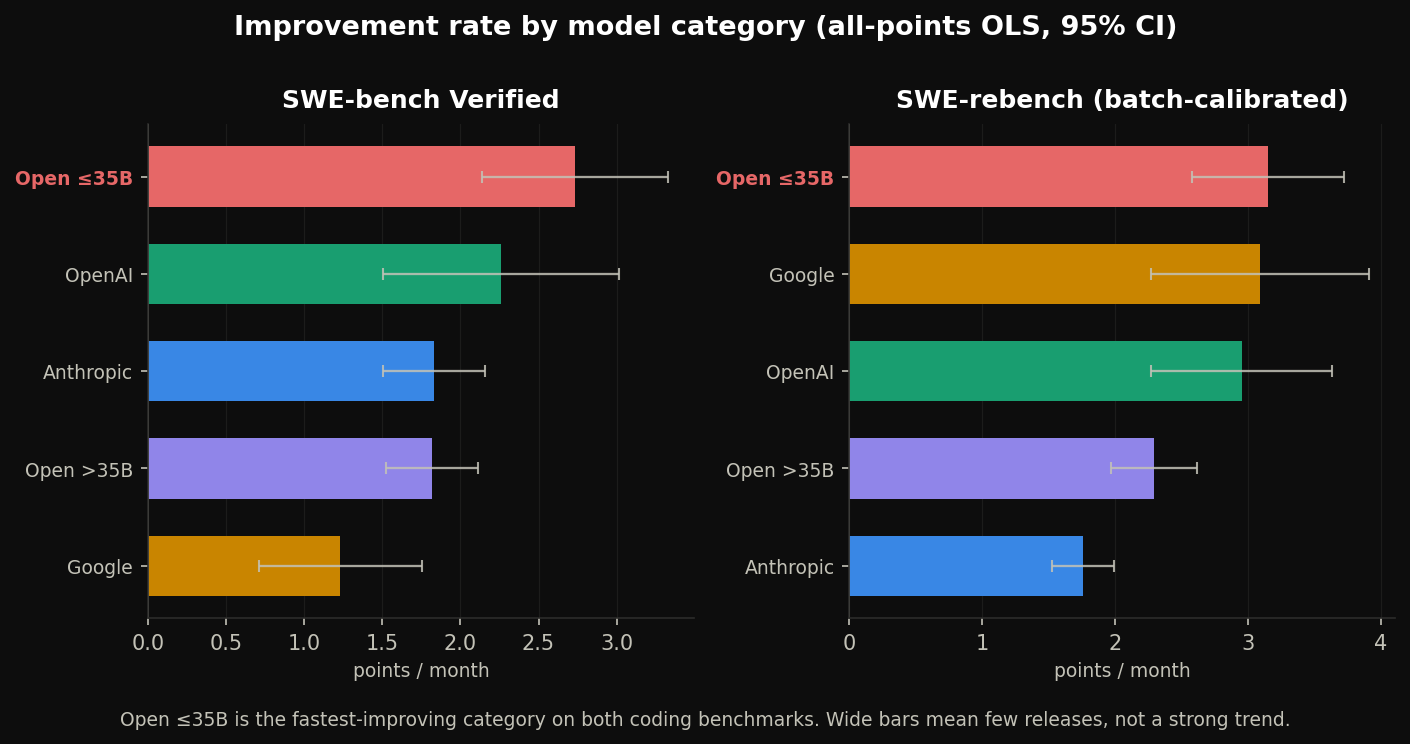
Points per month, with standard errors:
| Category | SWE-bench Verified | SWE-rebench (calibrated) |
|---|---|---|
| Open ≤35B | +2.73 ± 0.30 | +3.15 ± 0.29 |
| OpenAI | +2.26 ± 0.39 | +2.95 ± 0.35 |
| Anthropic | +1.83 ± 0.17 | +1.76 ± 0.12 |
| Open >35B | +1.82 ± 0.15 | +2.29 ± 0.17 |
| +1.23 ± 0.27 | +3.09 ± 0.42 | |
| Closed (combined) | +1.83 ± 0.16 | +2.54 ± 0.24 |
- Open ≤35B beats the combined closed cloud on SWE-bench Verified: +0.91/mo, z = 2.64, p = 0.008.
- It beats larger open models on both coding benchmarks: p = 0.007 and p = 0.011.
- It does not beat the single fastest closed lab on either. Against OpenAI on SWE-bench Verified, p = 0.34. Against Google on SWE-rebench, p = 0.91. Those differences are noise.
- On SWE-rebench it does not clear significance even against the combined closed cloud (p = 0.11).
Open sub-35B outruns closed AI as a category, and it does it on the public benchmark. However, it doesn't outrun OpenAI or Google and on the decontaminated benchmark, the distinction blurs.
3. So when do the lines cross?
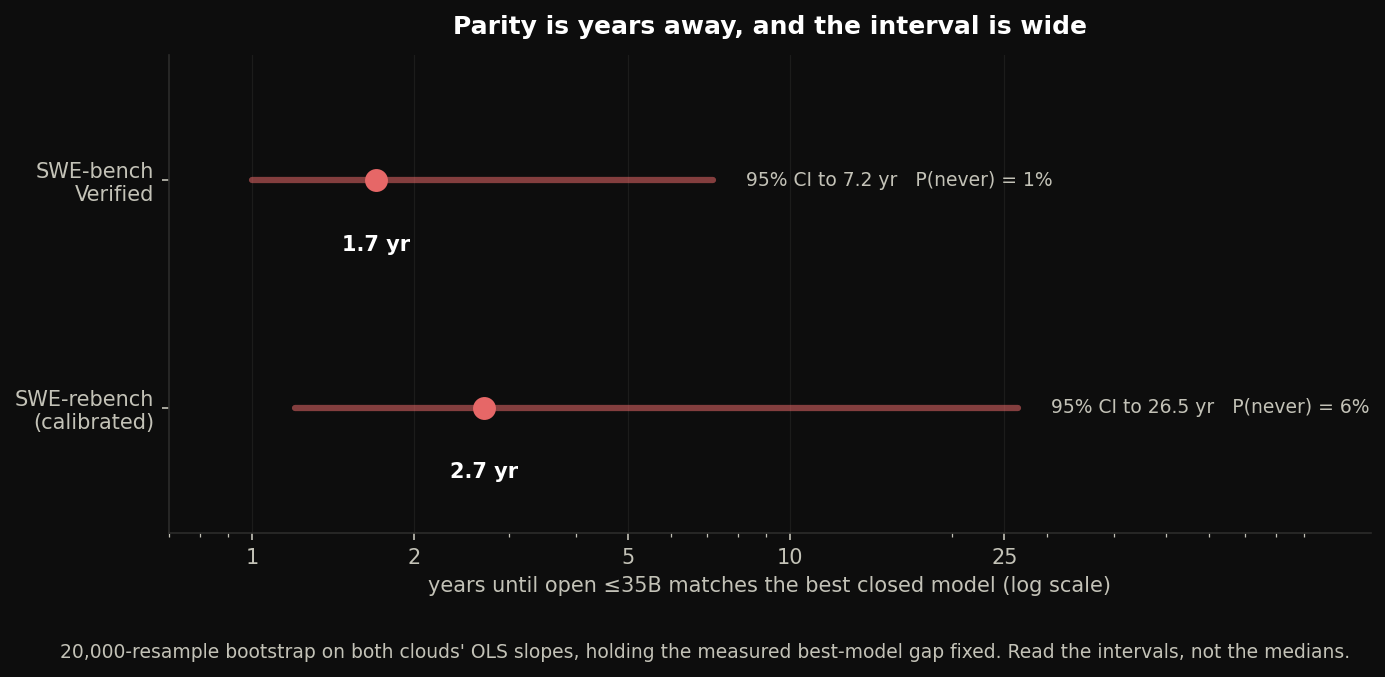
Everyone wants the date. Take the gap, let both clouds keep improving at their fitted rates, resample the points 20,000 times, and the date turns up with a confidence interval you won't enjoy.
| Benchmark | Best closed | Best open ≤35B | Gap | Years to parity | 95% interval | P(never) |
|---|---|---|---|---|---|---|
| SWE-bench Verified | 95.5 | 77.2 | 18.3 | 1.7 | 1.0 to 7.2 | 1% |
| SWE-rebench (calibrated) | 62.7 | 42.2 | 20.5 | 2.7 | 1.2 to 26.5 | 6% |
Ignore the medians. Two rising lines with similar slopes meet at a point that swings wildly on tiny changes to either slope, which is why the decontaminated upper bound runs 26.5 years out, and why a crossover date is fiction dressed as arithmetic. The lower bound is the only honest number here: even on optimistic assumptions, sub-35B open models don't catch today's closed frontier for at least a year, and the central estimate is two to three. And today's frontier isn't where the frontier will be.
Note what that assumes: both categories holding their present slopes forever. Nothing guarantees it. Benchmarks saturate, labs pivot, and eighteen months of slope isn't a law of physics. It's the best available estimate of who's covering ground faster right now. That's all it is, and it's still more than the leaderboard tells you.
4. The benchmark that cannot be gamed, read correctly
SWE-bench Verified has been public long enough that its problems leak into training sets, and every lab tunes its agent scaffold against it. Treat it as capability, plus contamination, plus effort spent gaming a fixed test. SWE-rebench pulls fresh GitHub issues every month, so nobody's trained on them.
It also can't be read straight off the leaderboard, which is a trap almost everyone walks into. SWE-rebench draws a new task batch each month and never re-runs older models, so any two headline scores were usually earned on completely different problems. Batch difficulty varies a lot: across the ten models run on both the February and the March-to-May 2026 batches, the later batch scored 9.4 points lower on average.
To compare anything, you have to strip out the batch effect. Models that ran on several batches bridge them by alternating least squares, then express every model on one reference batch:
logit(score[model, batch]) = ability[model] + difficulty[batch]
All 35 batches form a single connected component, so all 88 models anchor to it. The leave-one-out residual is about 2.5 points. The dashboard does this daily.
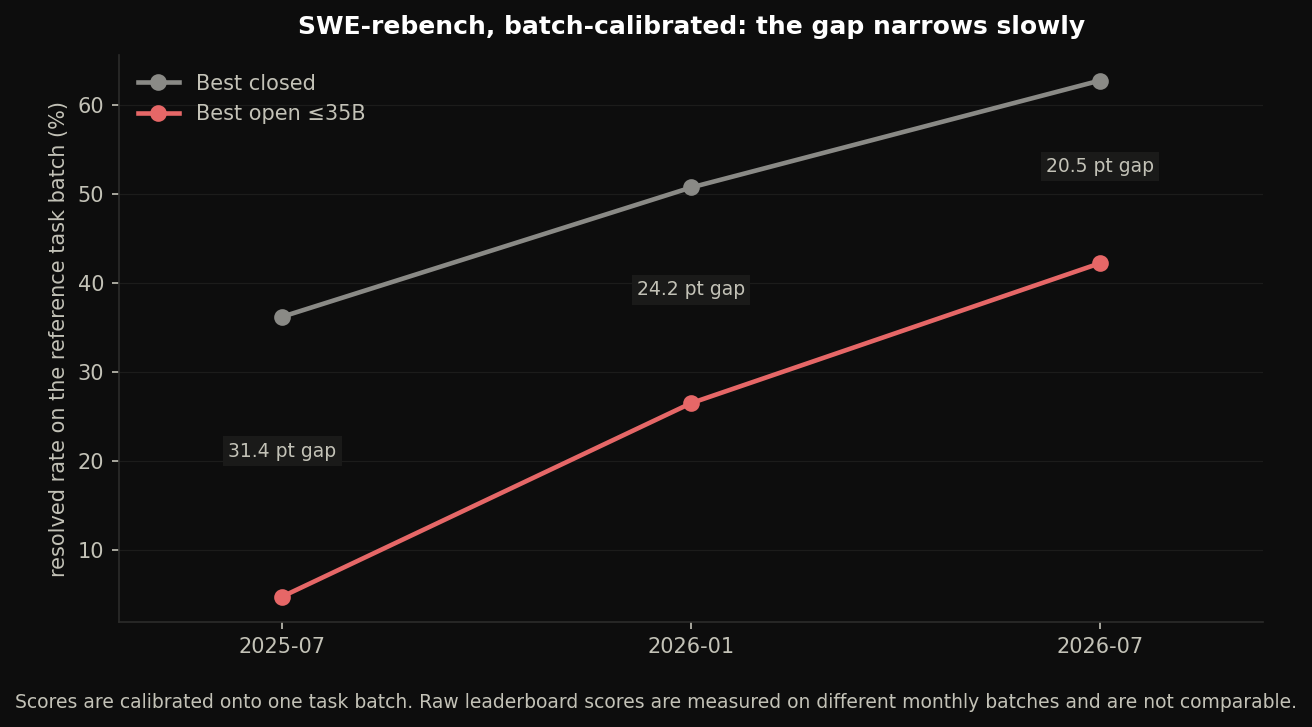
Calibrate it and the decontaminated picture gets worse for open models, not better. That's the opposite of what the open-source case usually assumes:
- Best closed: 62.7 (GPT-5.5). Best open ≤35B: 42.2 (Qwen3.5-27B). Gap: 20.5.
- Claude Opus 4.8 scores 56.5, comfortably above every sub-35B open model.
Read the raw leaderboard and Qwen3.5-27B (58.9) appears to beat Claude Opus 4.8 (56.5): a 27B model on your desk outscoring a frontier lab. It's an illusion. That compares a February score against a March-to-May score, and Opus 4.8 never touched the February batch. Put both on the same tasks and the 27B model sits 14 points behind Opus and 20 behind the leader. Contamination cuts both ways, and so does careless arithmetic.
5. Don't count SpaceXAI out
xAI barely appears above. Two data points on SWE-bench Verified, two on SWE-rebench, too few to fit a trend at all. On the numbers it's a non-participant. However, Musk's companies have a consistent record of refusing to compete head-to-head on the incumbent's terms, and instead rebuilding an industry around an approach nobody was pursuing: reusable orbital boosters at SpaceX, vertically integrated batteries and direct sales at Tesla, thin-film electrode threads at Neuralink. The pattern is never "win the benchmark." It's "make the benchmark the wrong thing to measure." A frontier-lab leaderboard is exactly the sort of incumbent scoreboard that record suggests he'd decline to climb.
With their recent takeover of Cursor (along with it's historic and future users' data) I wouldn't be surprised if they soon upset the industry with a shockingly capable new model. And if Musk hold's to his word of opensourcing their old models (note his timeline for Grok3 is ~5 months overdue), they could be set to drastically accellerate the RoC of open source models in the very near future.
6. What to watch
Not the leaderboard, but the RoC.
- Does open sub-35B hold above 2.7 points per month on SWE-rebench? The entire argument rests on this rate, and it's the one that isn't yet statistically distinguishable from the closed frontier's. Two more quarters should settle the significance issue.
- Does the SWE-bench Verified gap resume narrowing? It closed to 12.9 points in January 2026 and has widened to 18.3 since. One more widening half-year and the speed advantage stops showing up where it's supposed to, which would refutate the thesis.
- Sub-35B within 10 points of the SWE-rebench leader. Currently 20.5 behind on properly calibrated tasks.
The bottom line
Current leading models quickly become history, but the rate of improvement is directional. Over eighteen months the smallest open models improved faster than the closed frontier, faster than the large open-weight models, faster than anything else on the board: 2.73 points a month against 1.83. That's the most important number about where this is heading, and it points at the models you can run on your gaming PC.
The advantage holds against the closed frontier as a whole (p = 0.008) and against bigger open models (p = 0.007). It does not hold against the fastest individual labs, and it doesn't reach significance on the decontaminated benchmark at all.
Which leaves exactly one defensible claim, and it's enough: the current leader doesn't always win.
Methodology
Slopes are ordinary least squares in points per month, with an MAD-based filter excluding only extreme residual outliers (threshold 2.5σ or 12 points, whichever is larger, applied only to categories with 8 or more releases). Significance via a two-sample z-test on the OLS standard errors. Time to parity via a 20,000-resample pairs bootstrap on both clouds' slopes, holding the measured best-model gap fixed; P(never) is the fraction of resamples in which open sub-35B does not improve faster than closed. That bootstrap assumes both categories hold their fitted slopes indefinitely. SWE-rebench scores are calibrated onto the 2026-03-01 to 2026-05-15 reference batch by an additive logit model fitted with alternating least squares over 377 model-batch results. Data date 2026-07-09.
Sources & further reading
- clankwright.com open-source LLM benchmark dashboard: the live dataset behind this article (SWE-bench Verified and SWE-rebench, refreshed daily).
- benchlm.ai SWE-bench Verified leaderboard
- SWE-rebench.com: decontaminated, monthly-refreshed SWE-bench-style leaderboard.
Corrections
- 2026-07-09. SWE-rebench scores were being compared across different monthly task batches, because the leaderboard's range buckets silently clamp to whatever tasks each model actually ran. This produced the claim that Qwen3.5-27B outscored Claude Opus 4.8. Scores are now calibrated onto one reference batch.
- 2026-07-09. Trendlines were fit to each category's running-best frontier, which cannot slope downward and overstates any category that ships models below its own record. They are now ordinary least squares over every point. This retired the earlier "open improves 1.5x faster than closed" headline, which survives only against the combined closed cloud on SWE-bench Verified.